How rich is a galaxy cluster?

Post by Tom Kitching


In a recent paper http://arxiv.org/abs/1409.3571 lead by Jes Ford http://www.phas.ubc.ca/~jesford/Welcome.html the mass-“richness” relation of galaxy clusters was investigating using data from the CFHTLenS survey.

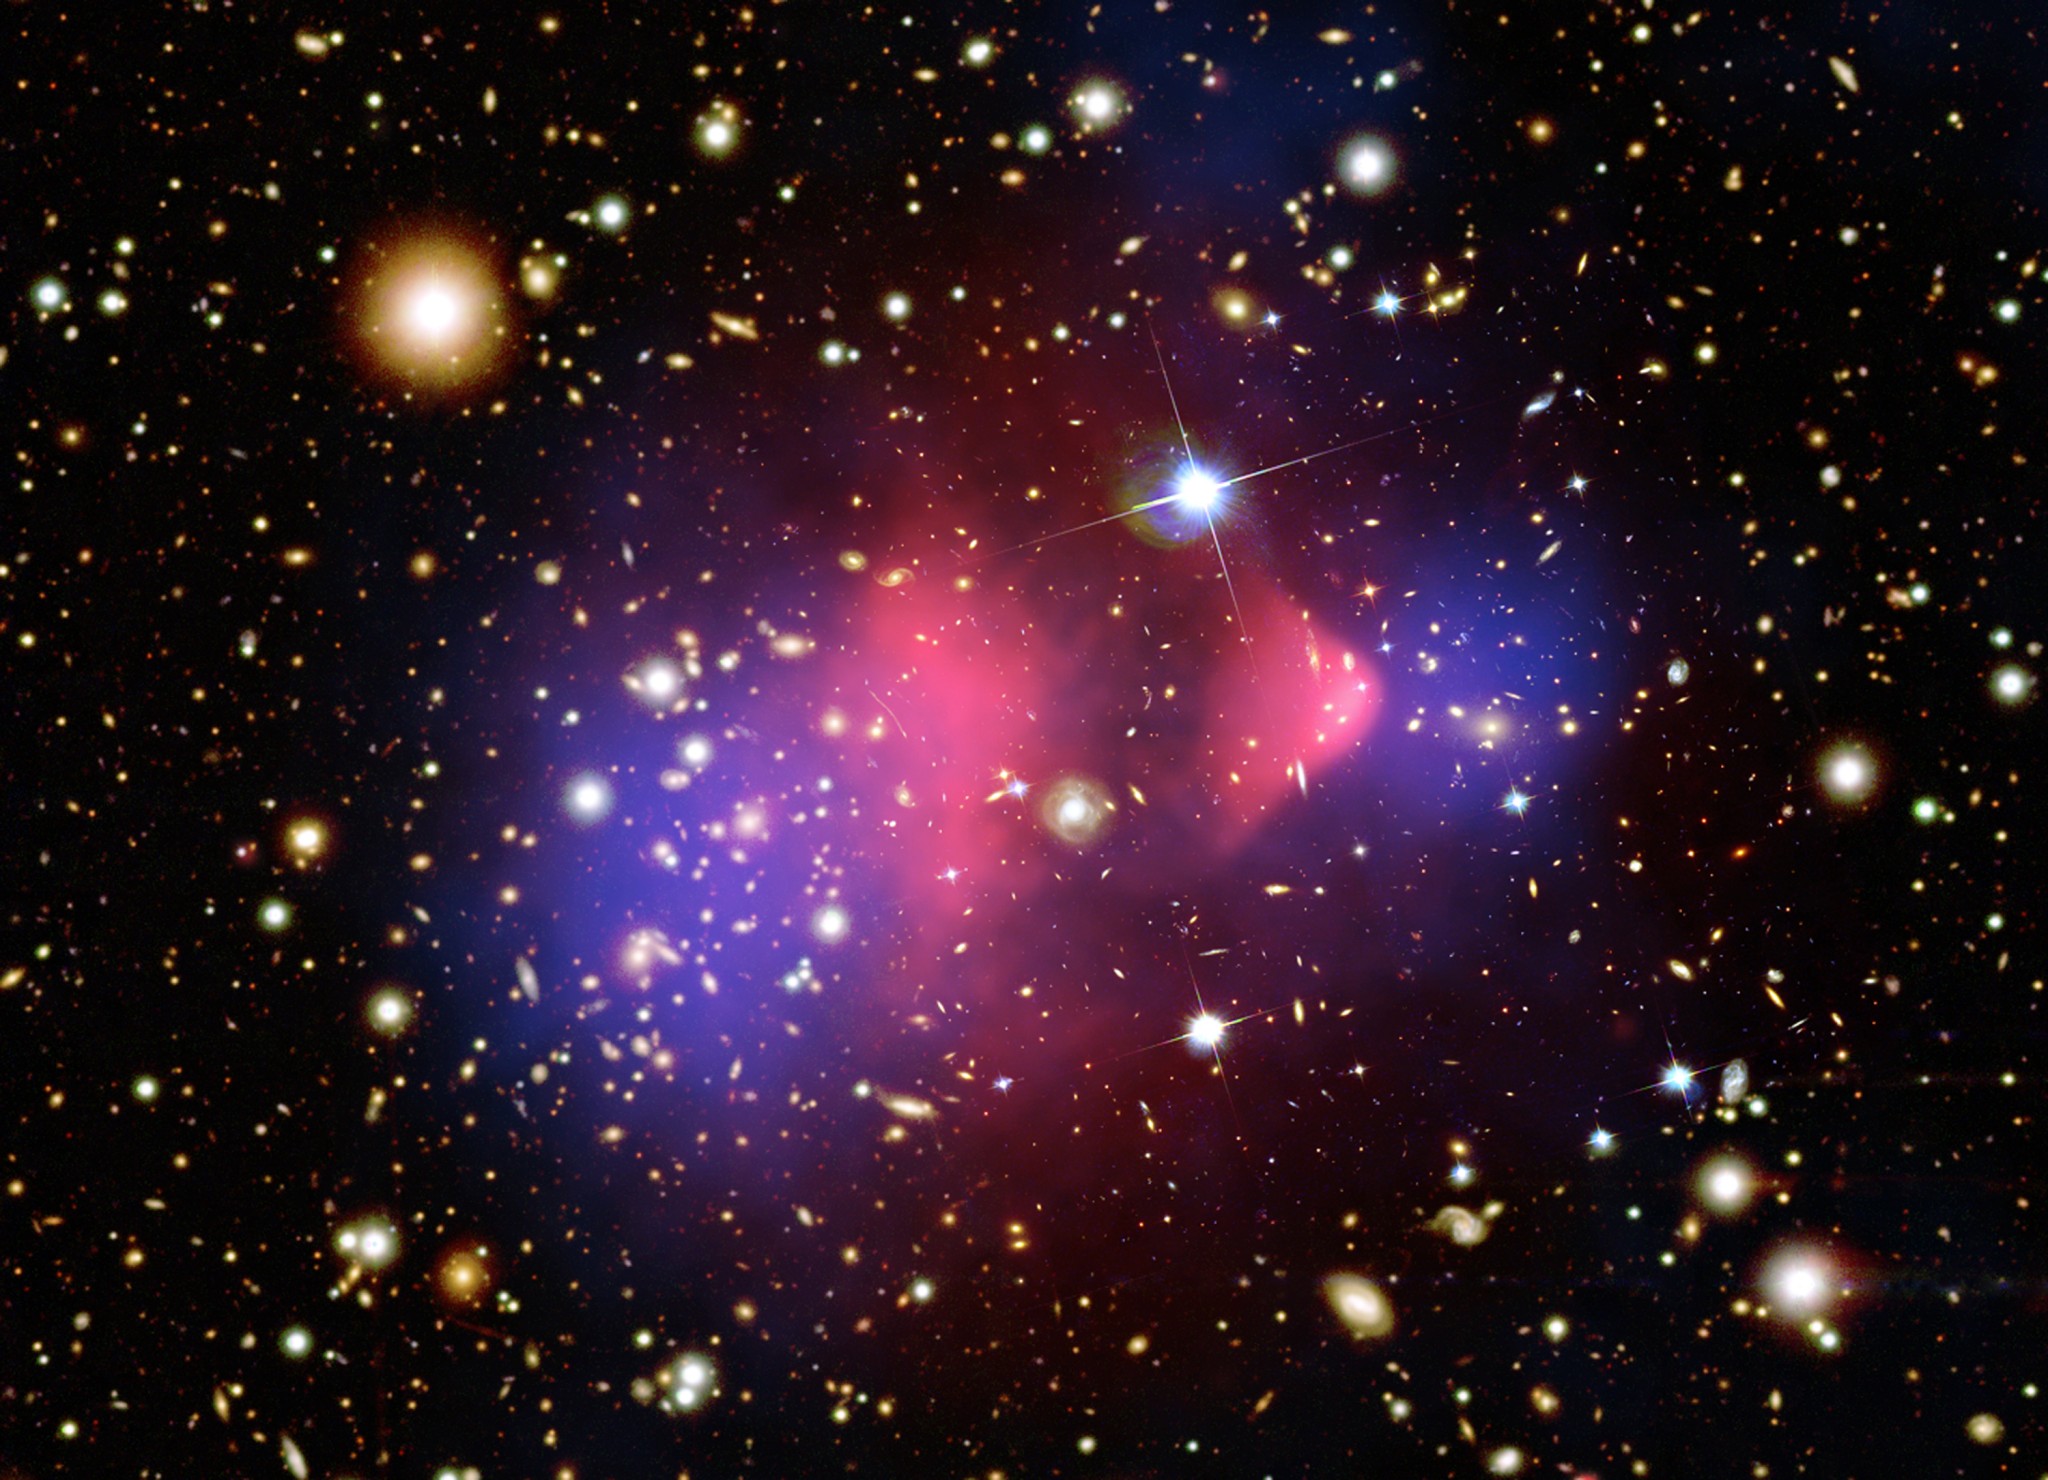
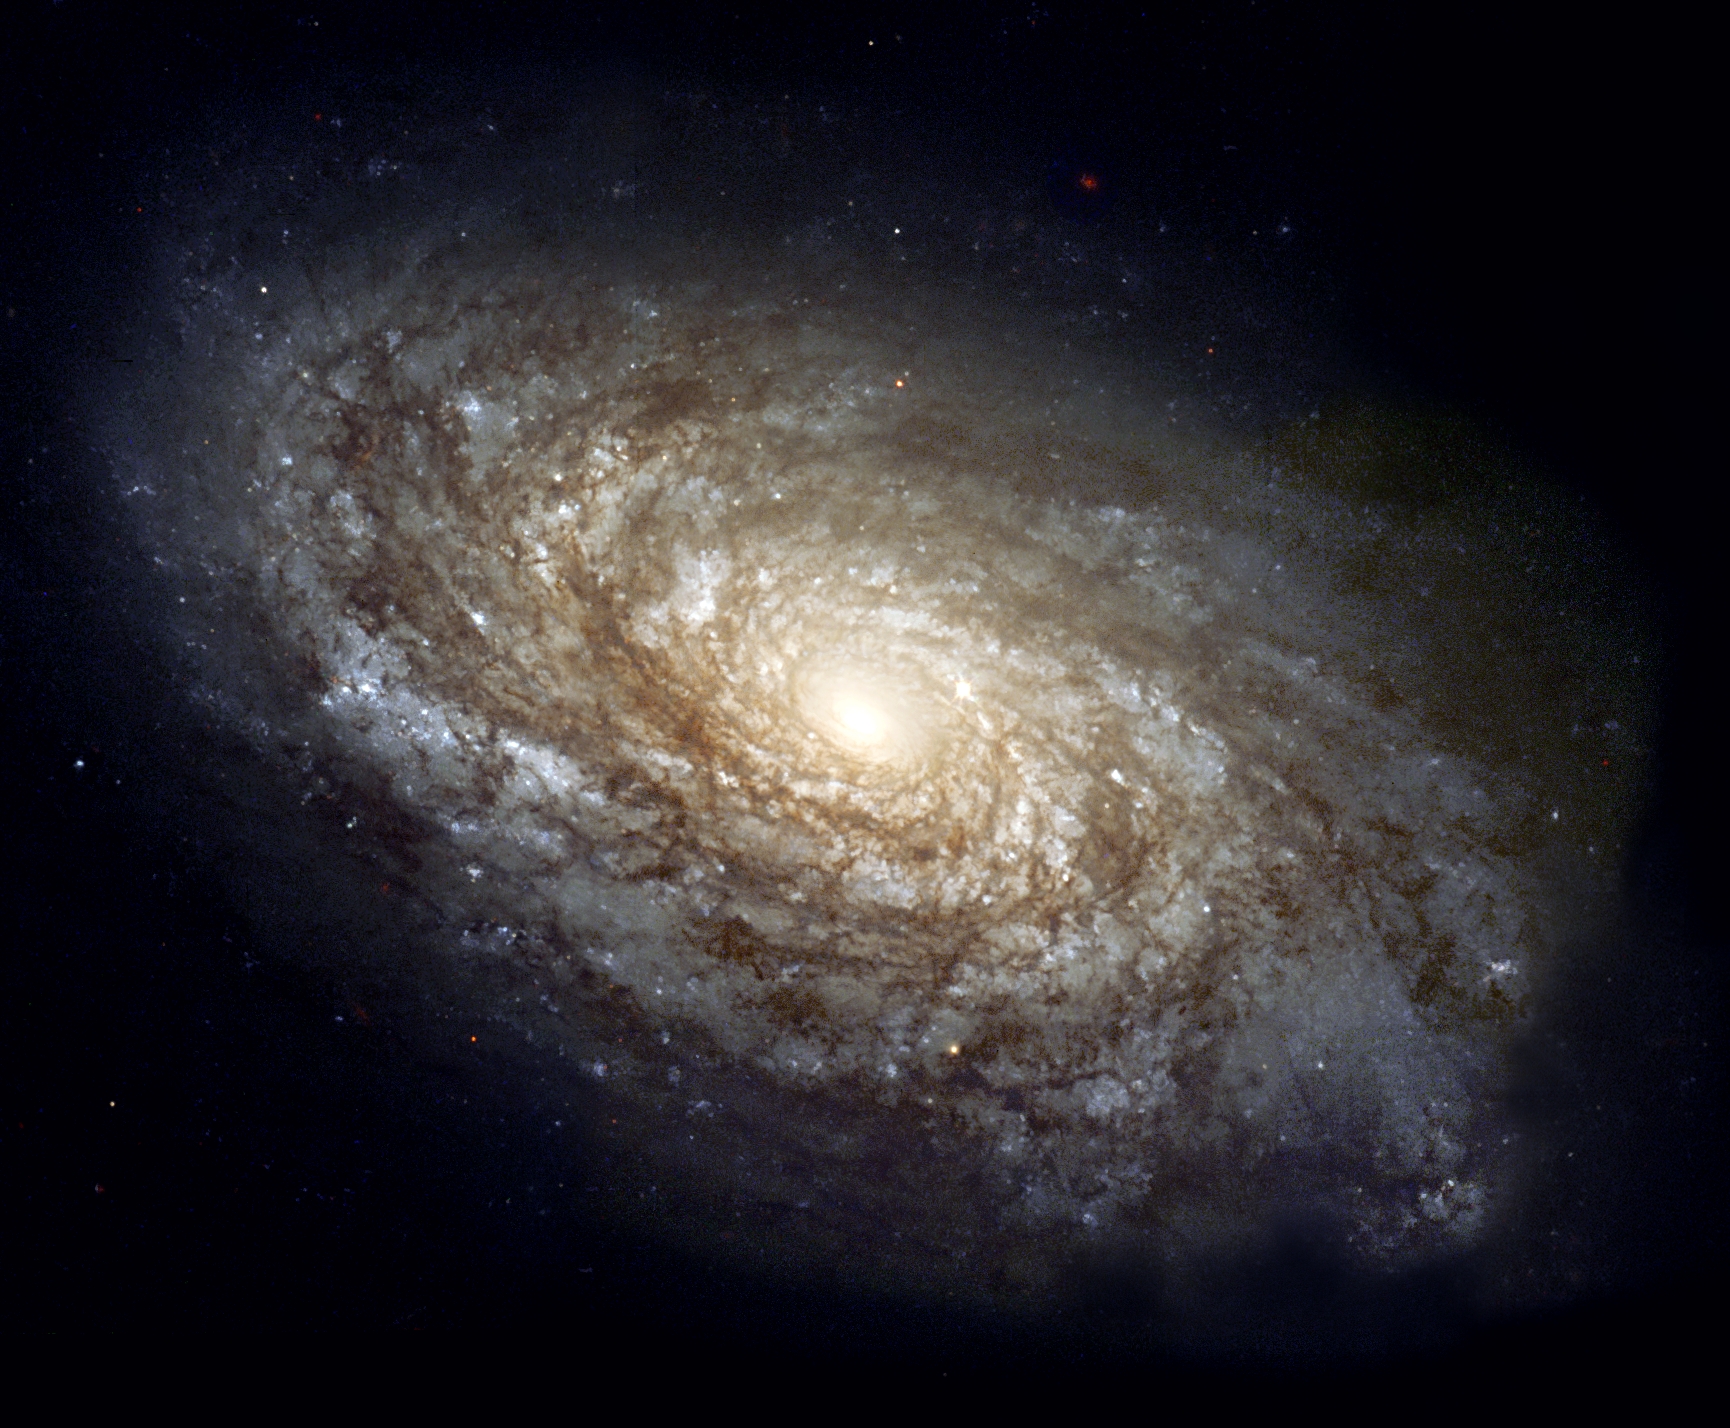
A galaxy cluster, is a cluster of galaxies… Galaxies are swarms of stars held together in a common gravitational potential, in an analogous way galaxy clusters are swarms of galaxies held together in a larger gravitational potential structure.

“Richness” is a bit of astronomical jargon that refers to the number of bright galaxies in a cluster. A cluster is “rich” if it has many massive galaxies and not rich if there are no massive galaxies. In fact, in a way that sounds quite PC, a galaxy cluster is never referred to as “poor”, but some galaxies have “very low richness”. This is a term that was first defined in the 1960s

[the richness of a cluster] is defined to be the number of member galaxies brighter than absolute magnitude Mi ≥ −19.35, which is chosen to match the limiting magnitude at the furthest cluster redshift that we probe

The clusters were detected using a 3D matched filter method. This allowed for a very large number of clusters to be found. 18,056 cluster candidates were found in total, which allowed for the statistics of this population of clusters to be measured.

The total significance of the shear measurement behind the clusters amounts to 54σ. Which corresponds to a (frequentist) probability of 1-4.645×10-636 or a

99.99999999999999999999999999999999999999999999999999999999999999999999999999999999999999999999999999999

9999999999999999999999999999999999999999999999999999999999999999999999999999999999999999999999999999999

9999999999999999999999999999999999999999999999999999999999999999999999999999999999999999999999999999999

9999999999999999999999999999999999999999999999999999999999999999999999999999999999999999999999999999999

9999999999999999999999999999999999999999999999999999999999999999999999999999999999999999999999999999999

9999999999999999999999999999999999999999999999999999999999999999999999999999999999999999999999999999999

99999999999999999%

chance that we have detected a weak lensing signal behind these clusters and groups!

The main result in the paper was the measurement that the mass of clusters increases with the richness with a relation of M200 = M0(N200/20)^β. This may be expected, that clusters that are more massive have more bright galaxies; after all a cluster is defined as a collection of galaxies. We found a normalization M0 ∼ (2.7+0.5) × 10^13 Solar Masses, and a logarithmic slope of β ∼ 1.4 ± 0.1.

Curiously no redshift dependence of the normalization was found. This suggests that there is a mechanism that regulates the number of bright galaxies in clusters that is not affected by the evolution of cluster properties over time. We do not know why this relationship should not change over time, or why it has the values it does, but we hope to find out soon.


combining information over 13 billion years of time

Post by Tom Kitching, MSSL


Combining information over 13 billion years of time

On this blog we have already talked about 3D cosmic shear and the Cosmic Microwave background, this post is about how to combine them.

Cosmic shear is the effect where galaxy images, that are (relatively!) near-by – a mere few billion light years – are distorted by gravitational lensing caused by the local matter in the Universe. We can measure this and use the data to learn about how the distribution of matter evolved over that time.

The Cosmic Microwave Background (CMB) is the ubiquitous glow of microwaves, that comes from every part of the sky, and that was emitted nearly 14 billion years ago. Analysis of the CMB allows us to learn about the early Universe, but also the nearby Universe because the local matter also gravitationally lenses the microwave photons.

In a recent paper we have shown how to combine Cosmic Shear information and CMB together in a single all-encompassing statistic. Because we see the Universe in three dimensions (2 on the sky and one in distance or look-back-time) this new statistic needed to work in three dimensions too.

Depicts: Gravitational lensing of the Cosmic Microwave Background Copyright: ESA and the Planck Collaboration http://sci.esa.int/science-e-media/img/96/Planck_gravitational_lensing_CMB_625.jpg

What we found was the when the galaxy and microwave data are combined properly the resulting statistic is more powerful than the sum of the two previous statistics, because there is the extra information that comes from the “cross-correlation” between them. In particular we found that the extra information helps in measuring systematic effects in the cosmic shear data.

What is a “cross correlation”?

A correlation is a determined relationship between two things. The definition (that the Apple dictionary on my computer gives) is

noun

a mutual relationship or connection between two or more things

In recent cosmological literature we use this term somewhat colloquially to refer to relationship between data points in a single data set. For example one could correlate the position of galaxies separated by a particular separation – to determine if they were clustered together – or one could correlate the temperature of microwave emission from different parts of the sky (both of these have been done with much success).

The word “cross” in “cross correlation” refers to taking correlations of quantities observed from different data sets. The addition of the word “cross” seems somewhat superfluous in fact. If we have experiment A and B one can correlate the data points from A, or correlate data points from B, or correlate data points between A and B.

In the new paper we instead used a more descriptive nomenclature that refers to inter and intra datum aspects of the analysis. Intra-datum means using statistics within a single data set and inter-datum means calculating statistics between them; for example the plotting a histogram of points within a data set, compared to plotting the points from two data sets on one graph.

When should one attempted to find inter-datum correlations between any data points? In this regard there seems to be two modes of investigation that one could take, following a Popper-inspired categorisation one can define the following modes:

  • Deductive mode. In this approach one has a clearly defined scientific hypothesis, for example the measurement of some parameter (or model) predicted to have a given value(s). Then one can find a statistic that maximises the signal-to-noise (or expected evidence ratio) for that parameter or model. That statistic may or may not include inter-datum aspects.
  •  Inductive mode. Alternatively one may simply wish to correlate everything with everything, with no regard to a hypothesis or model. In this approach the motivation would just be to explore the space of possibilities; trying to find something new. If a positive correlation is found then this may, or may not, indicate an underlying physical process or causal relation between the quantities.

The danger of an inductive approach, of course, is one can find correlations for which the underlying physical process is much more complicated than that taken at face value. To illustrate this point one can look on Google Correlate and find some interesting correlations, for example:

According to Google Correlate searches for "Astronomy" are highly correlated with searches for "Bass Guitar".  http://www.google.com/trends/correlate/search?e=astronomy&e=bass+guitars&t=weekly&p=us&shift=3&filter=astronomy#scatter,60

According to Google Correlate searches for “Astronomy” are highly correlated with searches for “Bass Guitar”.
http://www.google.com/trends/correlate/search?e=astronomy&e=bass+guitars&t=weekly&p=us&shift=3&filter=astronomy#scatter,60

Which brings us to an old warning from @LegoAcademics that:


Points to Three Points

Post by Tom Kitching, MSSL

—-

In a recent paper, led by collaborator Dr Liping Fu the CFHTLenS survey was used to measure the “3-point correlation function” from weak lensing data. This is one of the first times this has been measured, and certainly one of the clearest detections.

A “2-point” statistic, in cosmology jargon, is one that uses two data points in some way. Usually an average over many pairs of objects (galaxies or stars) are used to extract information. In this case what is being measured is called the “two-point [weak lensing] correlation function” and what it measures is the excess probability that any pair of galaxies (separated by a particular angular distance) are aligned. This is slightly different to a similar statistic used in galaxy cluster analysis. The two-point correlation function is related to the Fourier transform of matter power spectrum and can be used to measure cosmological parameters, which is why we are interested in it. In a sense the two-point correlation function is like a scale-dependent measure of the variance of the gravitational lensing in the data: the mean orientation of galaxies is assumed to be zero (when averaged over a large enough number) because there is no preferred direction in the Universe, but the variance is non-zero.

2p

The measurement of the 2-point statistic is represented above, “sticks” (of various [angular] lengths) are virtually analysed on the data and the for each stick-length the ellipticity (or “ovalness”) of the galaxies along the direction of the sticks is measured. If the two galaxies are aligned then the multiplication of these ellipticities (e * e) will be positive, but if not then sometimes it will be positive and sometimes negative.

Ellipticity can be expressed as two number e1 and e2 that lie on a Cartesian graph where positive and negative values represent different alignments. When multiplied together aligned ellipticities therefore produce a positive number and anti-aligned produce a negative number. When averaged over all galaxies a purely random field with no preferred alignment (equal positive and negative) the multiplication averages to zero. If there is alignment the average is positive.

Ellipticity can be expressed as two numbers e1 and e2 that lie on a Cartesian graph where positive and negative values represent different alignments. When multiplied together aligned ellipticities therefore produce a positive number and anti-aligned produce a negative number. When averaged over all galaxies a purely random field with no preferred alignment (equal positive and negative) the multiplication averages to zero. If there is alignment the average is positive.

Galaxies will align is there is some common material that is causing the gravitational lensing to be coherent. So when averaged over many galaxies the multiplication of the ellipticities <e*e> (the angular brackets represent taking an average) for a particular stick length tells us whether there is lensing material with a scale the same as the sticks length: a positive result means there is alignment on average, a zero result means there  is no alignment on average, a negative result would mean there is anti-alignment on average.

Figure from Kitching et al. (Annals of Applied Statistics 2011, Vol. 5, No. 3, 2231-2263). Gravitational lensing from the large scale structure in the universe makes preferred aligned occur around clusters of dark matter of around voids, what we call "E-mode". Anti-alignment is not normally caused by gravitational lensing, what we call "B-mode".

Figure from Kitching et al. (Annals of Applied Statistics 2011, Vol. 5, No. 3, 2231-2263). Gravitational lensing from the large scale structure in the universe makes preferred aligned occur around clusters of dark matter of around voids, what we call “E-mode”. Anti-alignment is not normally caused by gravitational lensing, what we call “B-mode”.

In this new paper we not only measured the two-point correlation function but also the 3-point correlation function! This is an extension of the idea to now measure the excess probability that any 3 galaxies have preferred alignment. Now instead of a single angle and pairs of galaxies the measurement uses triangle configurations of galaxies and results in a measurement that depends on two angles.


3p

This is a much more demanding computational task, because there are many more possible ways that triangle can be drawn than a stick (for every given length of stick the other two sides of the triangle can take many different lengths). The amplitude of the 3-point correlation function tells us if there is any coherent structure on multiple-scales, and in particular allows us to test whether the simple description of large-scale structure using only the 2-point correlation function – and the matter power spectrum – is sufficient or not.

This is one of the first measurements of this statistic and paves the way for extracting much more information from lensing data sets than could be done using 2-point statistics alone.

  • The full article can be found at this link : http://arxiv.org/abs/1404.5469
  • The CFHTLenS data can be accessed here : http://www.cfhtlens.org


Science on the Sphere

Science on the Sphere 

A Royal Society International Scientific Seminar 

14th and 15th July 2014, Chicheley Hall

This webpage is dedicated to the organisation of the Science on the Sphere meeting, to be held at the Royal Society Chicheley Hall on 14th and 15th July 2014.

Synopsis of the Meeting:

Scientific observations are made on spherical geometries in a diverse range of fields, where it is critical to accurately account for the underlying geometry where data live. In cosmology, for example, observations are inherently made on the celestial sphere. If distance information is also available, for example as in galaxy surveys, then the sphere is augmented with the radial line, giving three dimensional data defined on the ball. Future galaxy surveys will provide data of unprecedented detail; to fully exploit such data, three-dimensional analyses that faithfully capture the underlying geometry will be essential to determine the nature of dark energy and dark matter. On stellar scales new experiments are allowing the internal structure of distant stars, and our own Sun, to be analysed for the first time. At home, on Earth, our planet is being imaged and mapped in its entirety; an increasingly important endeavour as we face global challenges. On an individual level medical imaging, and also the computer gaming and special effects industries, require spherical analysis techniques in order develop efficient algorithms. All of these areas share common problems; this seminar series will bring together experts from across these fields to share common solutions and to create new ideas in the collaborative environment of the Royal Society.

Outcomes of the Meeting:

A diverse range of fields, from cosmology and astronomy, to stellar and geophysics, to medial imaging and computer graphics, share common data analysis challenges. In all of these fields, data are observed on spherical geometries; the subsequent analysis of such data must accurately account for their underlying geometry in order to draw meaningful scientific conclusions. Indeed, the field of principled data analysis on spherical geometries is a field in itself. However, all of these fields are largely disjoint at present. The goal of this multi-disciplinary seminar series is to bring together researchers from these fields in order to address their common data analysis challenges. Seminars will be organized to introduce the assembled experts to new fields, and to the topical spherical data analysis challenges faced in these fields, where it is envisaged that insights from one field will have wide-reaching implications in other fields. By fostering contact between these diverse communities and promoting interdisciplinary collaborations, a coherent and principled approach to the analysis of data observed on spherical geometries will gain wide-spread traction, potentially leading to new and robust scientific findings in a wide range of fields.

Invited Participants:

Alan Heavens Imperial
Andrew Jaffe Imperial
Ben Wandelt IAP
Bill Chaplin Birmingham
Boris Leistedt UCL
Chris Doran Geomerics
Domenico Marinucci Rome
Farhan Feroz Cambridge
Francois Lanusse CEA Saclay
Frederik Simons Princeton
Hiranya Peiris UCL
Jason McEwen UCL
Mike Hobson Cambridge
Pierre Vandergheynst EPFL
Richard Shaw CITA
Rod Kennedy ANU
Tom Kitching UCL
Yves Wiaux Heriot Watt
Yvonne Elsworth Birmingham

Local and Travel Information

The Royal Society provide local information here (https://royalsociety.org/visit-us/chicheley/)

More information on the venue is available here (http://en.wikipedia.org/wiki/Chicheley_Hall)

Programme

Day 1

  • 0730 – 0830 : Breakfast

Day 2

  • 0730 – 0830 : Breakfast
  • Discussions and the Way Forward
  • 1600 – 1700 : Dr Jason McEwen (UCL), Dr Thomas Kitching (UCL)

This meeting is funded by the Royal Society International Scientific Seminar Scheme  

This meeting is organised by: Dr Thomas Kitching and Dr Jason McEwen


The power of three

Post by Tom Kitching

Today a paper of mine that I have been working on for the last few years was posted to the arXiv.

The subject of the paper is a method called “3D cosmic shear”. It’s a particularly important subject because there are several new telescopes, and surveys that have been designed, or are being built, that intend to use such methods to measure the properties of dark energy. What we found in this paper is that some of the assumptions that have been made about how dark matter and ordinary matter interact in the cosmic web could be incorrect, which means the interpretation of the data from the new experiments will be a bit more complicated than cosmologists previously thought…

What is 3D cosmic shear?

Let’s start with the 3D part of the name. The Universe is filled with galaxies, which are sprinkled throughout the cosmic web of dark matter (one may say sprinkled like raisins in the infinite hot-cross-bun that is the Universe, but let’s not push the analogy too far).

Plot credit: S. Columbi and Y. Mellier. Matter is distributed as a cosmic web (orange) and galaxies are sprinkled within this web (blue dots). Light from the galaxies (yellow lines) is distorted by the gravitational field of the web and causes a small change in the ellipticity of the galaxy images.

Plot credit: S. Columbi and Y. Mellier. Matter is distributed as a cosmic web (orange) and galaxies are sprinkled within this web (blue dots). Light from the galaxies (yellow lines) is distorted by the gravitational field of the web and causes a small change in the ellipticity of the galaxy images.

We live in one of those galaxies, the Milky Way, so as we observe the Universe what we see are galaxies scattered across the sky (2-dimensions, north-south and east-west, or “right ascension” and declination). We also see galaxies in a 3rd dimension of redshift. This 3rd dimension is a little more complicated to understand: because the speed of light is finite the galaxies we see that are a long way away in the 3rd dimension are not only distant in a space but also distant in time. The 3D distribution of galaxies we see is consists of galaxies that are scattered across space and time.

3D2

But what else happens to light as it propagates towards us? Well, all of the matter from which the cosmic web is made, like all matter everywhere, has a gravitational field, and gravity is a force that pulls things together. You are being pulled by Earths gravity to the ground, the Earth (and you) are being pulled by the Suns gravity, the Sun (and you, and the Earth) are being pulled by all of the other stars in the Milky Way… and so on and so forth. Light doesn’t escape the universal attraction of gravity, and it is also pulled towards objects that have mass. The effect of gravity on a light ray is known as gravitational lensing, what happens (when the gravitational field is weak) is that an additional ellipticity (or “oval-ness”, technically this is the third flattening or third eccentricity of the galaxies observed shape) is imprinted on the image of a distant galaxy. We call this extra ellipticity “shear”.

Plot credit: T. Tyson. The light from distant galaxies is gravitationally lensed by the cosmic web of dark matter, inducing a small change in the ellipticity of the images of galaxies called cosmic shear.

Plot credit: T. Tyson. The light from distant galaxies is gravitationally lensed by the cosmic web of dark matter, inducing a small change in the ellipticity of the images of galaxies called cosmic shear.

The additional ellipticity caused by the cosmic web is known cosmic shear.

3D cosmic shear combines both information from the distances and spatial distribution of galaxies and the gravitational lensing effect of cosmic shear into a single analysis, and in the paper this was applied to a large survey for the first time. Because 3D cosmic shear maps the cosmic web and how it grows with time we can potentially learn about how the Universe evolved, and what its ultimate fate will be.

What did we find?

The paper used the method of 3D cosmic shear to analyse the largest/deepest optical wavelength survey of the sky to date CFHTLenS.

What we found is that matter in the Universe is clumped together less tightly than it should be if dark matter alone was responsible for the structure of the cosmic web.

Previously it has been assumed that the cosmic web of dark matter is not affected by the sprinkling of galaxies on top of it. However what we found is that there is evidence that the cosmic web of dark matter may actually be affected by the galaxies after all, in particular by the supermassive black holes that reside in the centres of the most massive galaxies, so-called Active Galactic Nuclei (AGN).

AGN may be impacting the distribution of dark matter in the Universe. Hubble Space Telescope image of a 5000-light-year-long (1.5-kiloparsec-long) jet being ejected from the active nucleus of the active galaxy M87, a radio galaxy. The blue synchrotron radiation of the jet contrasts with the yellow starlight from the host galaxy.

Alternatively things may be even weirder, another possibility is that what we are seeing the effect of massive neutrinos, or even a combination of effects. But a new mystery, and challenge for cosmologists, now exists. The normal matter and the dark matter seem to have an effect on each other: we may live in a more complicated Universe than we previously imagined. To resolve this mystery more data is now required, and more work to make the data analysis using 3D cosmic shear even more sensitive to the structure of the cosmic web within which we reside.

Materia Incognita

Post by Tom Kitching, MSSL

—-

Occasionally people ask me what I work on, and at some point in the conversation the words “dark matter” inevitably arise. Normally one would say that dark matter “is named because it does not emit or absorb light, unlike ordinary matter that does…”. However in every day usage an object is “dark” because either i) it is absorbing light, or ii) there simply is no detectable light present (its dark at night because your eyes can’t detect the very low level of optical photons around).

So if everyday things are dark because they do absorb light, why does dark matter not absorb light?

Dark matter is a material that constitutes the majority of the mass in the Universe, it doesn’t interact with other particles with light but it does with gravity. Light in fact passes straight through it, as does the atoms that make up the Earth and you and all the stars and galaxies we can see.

Where did the phrase “dark matter” come from? Wikipedia tells us the familiar story told to generations of new physics students that:

Astrophysicists hypothesized dark matter due to discrepancies between the mass of large astronomical objects determined from their gravitational effects and the mass calculated from the “luminous matter” they contain: stars, gas, and dust. It was first postulated by Jan Oort in 1932 to account for the orbital velocities of stars in the Milky Way and by Fritz Zwicky in 1933 to account for evidence of “missing mass” in the orbital velocities of galaxies in clusters.

In fact Zwicky referred to the matter as dunkle Materie that has a  German-to-English translation of dark matter. It is interesting to note that dark matter did not enter the common scientific canon, or popular culture for another 50 years after Zwicky’s discovery. A search for the term “dark matter” in books produces the figure below, where it can be seen that it was not until the 1980’s that the dark was popularised. This was due in a large part to the work of Vera Rubin in the 1970’s on galaxy rotation curves, that lead to the publication of an influential paper in 1980.

Search on https://books.google.com/ngrams/ for "dark matter". The percentage of books that contain this term.

Search on https://books.google.com/ngrams/ for “dark matter”. The percentage of books that contain this term.

Astronomers are used to seeing matter that is emitting light, primarily stars, so it is only natural to label everything else (that is not actively emitting or absorbing light) as being “dark”. So, we do have an excuse.. But the problem is that the word “dark” whilst, arguably, is descriptive of our ignorance, is not physically an accurate description when “dark” is used in its everyday form. So, when trying to describe the physics of dark matter the word “dark” can cause confusion. In fact as a noun the Oxford English Dictionary has 5 definitions for the word dark:

  • 1 a. Absence of light; dark state or condition; darkness, esp. that of night,  b. The dark time; night; nightfall., c. A dark place: a place of darkness.,
  • 2. fig. (a leap in the dark)
  • 3. a. Dark colour or shade; spec. in Art. a part of a picture in shadow, as opposed to alight.,  b. fig. A dark spot, a blot.
  • 4. a. The condition of being hidden from view, obscure, or unknown; obscurity. in the dark: in concealment or secrecy. b. Obscurity of meaning
  • 5. in the dark: in a state of ignorance; without knowledge as regards some particular fact.
So on the face of it “dark matter” satisfies several of these definitions, except that  it doesn’t quite fit any of them. Dark matter is not an “absence of light”, since light can pass straight through it: dark matter can in fact be permeated with light. Dark matter is not a “leap in the dark” since it is not a wild or speculative conjecture (although some may argue on this point). Perhaps the most appropriate is definition 4, but in fact dark matter is not hidden from view, since with gravitational lensing we can directly observe its effect.  And with definition 5, the usage is not quite correct, which should be “we are in the dark, about this matter”.  Furthermore the name is somewhat depressing, one of the OED adjectival definitions is “Devoid of that which brightens or cheers; gloomy, cheerless, dismal, sad.” (and of course no one wants to turn to “dark side”).

Direct imaging of dark matter in the “bullet cluster”, blue is dark matter density and red is X-ray gas. From http://apod.nasa.gov/apod/ap060824.html . Composite Credit: X-ray: NASA/CXC/CfA/ M.Markevitch et al.; Lensing Map: NASA/STScI; ESO WFI; Magellan/U.Arizona/ D.Clowe et al. Optical: NASA/STScI; Magellan/U.Arizona/D.Clowe et al.;

So perhaps we should look for alternative word to describe the matter with which the Universe is suffused, through which light can travel unhindered, and that acts as the cosmic scaffolding around which ordinary matter clusters. My humble proposals are either:
  • Transparent Matter : This has a nice descriptive word that actually has physical interpretation that is accurate. Clear matter would be along similar lines. If you are cosmologist would you prefer to be talking about transparent matter every day, or dark matter?
  • Materia Incognita : The unknown material. Maps used to be labelled with “terra incognita“, in a similar way we could be explicit about ignorance of its nature (caveat: my latin is possibly entirely incorrect). Maps also, according to legend, used to use the term “here be dragons”, so I am tempted to propose that dark matter should be called “Dragonite“, “Dragonium” or perhaps even “Smaugite“, but I won’t.
  • The Cosmic Scaffolding : This would explain an aspect of the role this matter plays in the growth of large-scale structure, but normal scaffolding can be seen, so perhaps “the transparent cosmic scaffolding”, but this is admittedly not as catchy as dark matter.

However the name dark matter is probably here to stay for the near future. But don’t worry because this will hopefully be a brief period as new direct detection experiments, and new cosmic sky surveys come online we will learn the true nature of this mysterious component of our Universe and give it its true name.

Weak Lensing in the Alps!

Post by Tom Kitching, MSSL

—-

This month I was very fortunate to be a lecturer at the TRR33 winter school in Passo del Tonale in the Italian Alps. The aim of the school was “Theory for Observers & Observations for Theorists”.

IMG_0821

My task for to educate the PhD students in weak lensing, which is a method that can be used to map dark matter and infer cosmology.

Over the course of the lecture we went through what a lens actually is, and I used some inspiration from Richard Feyman in his book QED. As light propagates from point A to point B it can take any possible path, with a particular probability.

t1

In his book Feynman then poses the thought experiment and asks what would happen if we “fooled the light” so that every path took the same amount of time. What we end up with is a lens!

t2

So in a certain sense you can think of a lens as a device for equalising the probability of paths between two points; or down-weighting the most likely paths. Of course, reality is much more complicated than that, but I was struck that this was a very nice way to explain why lenses work the way they do. These explanations, from a mathematical perspective are using the principle of least action, which is a powerful general technique used in physics. The amount of lensing caused by large scale structures in the Universe can be derived in a similar way.

It strikes me an elegant historical path that astronomy itself has taken: it was founded on the technological development of optical lenses, and that now as we are planning on surveying almost the entire sky over a significant fraction of the age of the Universe it is the motivation of observing the lensing caused by the Universe itself that is driving these ambitions (see for example Sami’s Euclid post).

The meetings organisers were amazingly good at arranging fun and engaging activities for the participants (as Peter Coles over at Telescoper eloquently remarked last year), who found themselves skiing, hiking through the night in snow shows, getting guided tours of the night sky (for some students it was the first time the Milky Way had been observed), and having 4 course meals every day for lunch and dinner!

One of the joys of being an astronomer is sharing your knowledge, exploring new places and meeting amazing people.

How does the mass-to-light ratio of galaxies change over time?

Post by Tom Kitching, MSSL

—-

In a recent paper, led by collaborator Dr Mike Hudson the CFHTLenS survey was used to investigate how the relationship between the total amount of matter surrounding galaxies, compared to the amount of luminous (stellar) matter changes as a the Universe ages.

There is a vast and growing amount of evidence that the stars we see in galaxies are just the tip of the ice-berg when it comes to the total amount of matter. In this recent paper the gravitational lensing signal around individual galaxies was used to measure the amount of total matter present; which would include any unseen or dark matter. It was confirmed that there is much more dark matter than star-matter, and that in fact there is roughly 30 times more dark matter than star-matter!

There is much more than meets the eye. The stars present in galaxies account for approximately 3% of the total matter present in most galaxies. From http://upload.wikimedia.org/wikipedia/commons/c/c3/NGC_4414_%28NASA-med%29.jpg

What this study found for the first time was that this ratio of dark matter to star-matter is not a constant as the Universe ages but is actually changing. It was found that the peak ratio falls as a function of cosmic time from 3.8±0.3 percent when the Universe was 7.4 billion years old to only 3.0±0.2 percent at when the Universe was 10.3 billion years old. This is a very precise measurement, measuring a change of only 1 percent over a timescale of nearly 3 billion years!

Why is this change happening? The paper shows that the change is actually dominated by changes in galaxies that are “red”, these are large and old galaxies where the production-rate of stars is slowing down as they run out of available gas, as the Universe ages. Interestingly if this change is dominated by the red galaxies then it implies that in the other galaxies, so-called “blue” galaxies, that are young and star-forming, the amount of stars that are made is balanced by the amount of dark matter attracted to those galaxies.

  • The full article can be found at this link : http://arxiv.org/abs/1310.6784
  • The CFHTLenS data can be accessed here : http://www.cfhtlens.org